The India Volatility Index (India VIX), often referred to as the market’s “fear gauge,” serves as a barometer of investor sentiment and expected market volatility. While elevated readings are typically associated with heightened uncertainty, low levels of the index—particularly when it slips into single digits—are not always reassuring. On the contrary, historical patterns suggest that extremely low volatility can signal complacency, leaving markets vulnerable to sharp corrections.
The Risk of Complacency
A subdued VIX environment typically coincides with inexpensive option premiums, muted demand for hedging, and an overarching sense of stability. Investors and traders begin to treat equities as if they are immune to risk. This complacency creates fragile market conditions. When volatility is suppressed, any exogenous shock—be it macroeconomic, geopolitical, or policy-driven—can produce an outsized reaction as volatility sellers are forced to unwind their positions.
Historical Precedents
- 2007–08 (Global Financial Crisis):
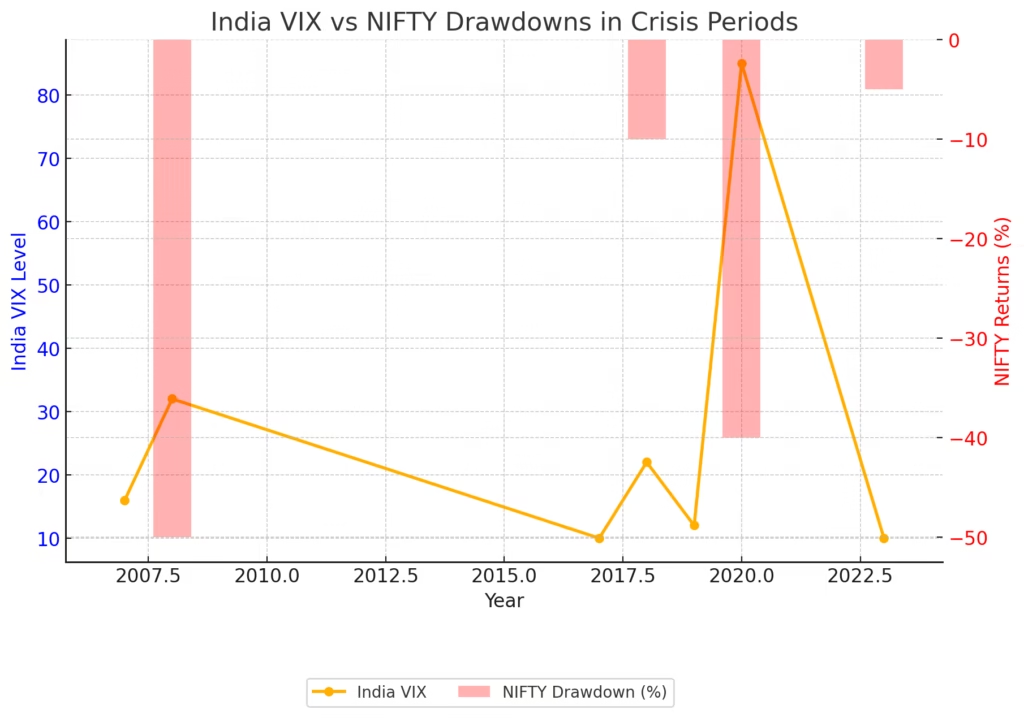
Ahead of the crisis, India VIX remained relatively calm at ~16. The subsequent market collapse saw the NIFTY fall by nearly 50%, while volatility more than doubled. - 2017 (Volatility Shock):
India VIX drifted to all-time lows of 9–11. The February 2018 global volatility event triggered a 10% decline in the NIFTY within two weeks, as India VIX surged beyond 20. - 2019–20 (COVID-19 Pandemic):
With VIX near 11–12, markets appeared stable. The sudden onset of the pandemic, however, led to a 40% drawdown in the NIFTY and sent India VIX soaring to 85, its highest reading on record. - 2023 (Geopolitical and Policy Shocks):
Once again, VIX hovered around 9–11. A combination of Federal Reserve policy shifts and geopolitical tensions sparked a 3–5% correction in equities, with VIX swiftly rising to 18+.

India VIX vs NIFTY Drawdowns in Crisis Periods
- Blue line: India VIX spikes during major events.
- Red bars: Corresponding NIFTY drawdowns.
This makes the historical relationship between low-VIX complacency and sudden market shocks very clear.
Key Takeaways
The data underscores a recurring theme: low volatility does not cause crises, but crises often erupt from periods of low volatility. When the market is positioned for calm, shocks are amplified, and volatility regimes can shift abruptly.
Strategic Implications for Market Participants
- Insurance is Cheapest in Calm Periods: Low option premiums provide an opportunity to secure hedges at relatively low cost.
- Maintain Vigilance: A low VIX should be treated as a cautionary signal, not a comfort indicator.
- Prepare for Regime Shifts: Market stability can reverse quickly, often without early warning.
Conclusion
A single-digit India VIX reflects more than investor confidence; it often reflects investor overconfidence. For seasoned market participants, such levels should not be interpreted as a sign of safety, but as a potential precursor to instability.
In markets, extended calm is rarely permanent. History shows that when fear is absent, risk is often hiding in plain sight.
Take action today—start planning for your financial future, or consult a wealth manager to help grow and protect your assets.
Contact us for your wealth management and more information.
Email: pramod.gamare@hotmail.com
Phone: 7559411986
Post Disclaimer
Disclaimer
1. The Alpha Wealth is a wealth advisory offering financial services viz and third-party wealth management products. The details mentioned in the respective product/ service document shall prevail in case of any inconsistency with respect to the information referring to BFL products and services on this page.
2. All other information, such as, the images, facts, statistics etc. (“information”) that are in addition to the details mentioned in the The Alpha Wealth product/ service document and which are being displayed on this page only depicts the summary of the information sourced from the public domain. The said information is neither owned by The Alpha Wealth nor it is to the exclusive knowledge of The Alpha Wealth. There may be inadvertent inaccuracies or typographical errors or delays in updating the said information. Hence, users are advised to independently exercise diligence by verifying complete information, including by consulting experts, if any. Users shall be the sole owner of the decision taken, if any, about suitability of the same.
Standard Disclaimer
Investments in the securities market are subject to market risk, read all related documents carefully before investing.
Research Disclaimer
Sub-Broking services offered by Sharekhan LTD | REG OFFICE: Badlapur, Thane 421503. Corp. Office: ---, Maharashtra 421503. SEBI Registration No.: --| BSE Cash/F&O/CDS (Member ID:--) | NSE Cash/F&O/CDS (Member ID: --) | DP registration No: --- | CDSL DP No.: --| NSDL DP No. --| AMFI Registration No.: ARN –253455.
Website: https://thegreenbackboogie.com//
Research Services are offered by The Alpha Wealth as Research Analyst under awaiting SEBI Registration No.: ---.
Details of Compliance Officer: -- | Email: --/ --- | Contact No.: -- |
This content is for educational purpose only.
Investment in the securities involves risks, investor should consult his own advisors/consultant to determine the merits and risks of investment.
